China’s metals and mining sector is the largest and most strategically complex commodity equity market in the world. The country dominates global production, processing, and downstream fabrication of copper, aluminum, and rare earth elements — three material groups that sit at the intersection of the green energy transition, advanced manufacturing, and great-power competition. For global investors, this creates a rare combination: deep cyclical opportunities, genuine structural growth tailwinds, and an irreducible layer of geopolitical and policy risk that no screener or price chart can fully capture.
This guide provides institutional investors with a full analytical framework: how the sector is structured, what drives returns at each stage of the value chain, how to access these markets via A-shares, Hong Kong listings, and ETFs, how to screen and select quality companies, and how to understand the rare earth elements universe in practical investment terms. It is designed to go materially deeper than quote pages and financial databases.
1. Sector Map: What Counts as “China Metals & Mining”
The Universe and Its Structural Uniqueness
China’s metals and mining equity universe encompasses companies operating across five distinct tiers of the value chain — from ore extraction to final product fabrication. The critical investor insight is that these tiers carry fundamentally different return profiles, risk characteristics, and policy sensitivities. A copper miner, a copper smelter, and a copper foil manufacturer can have the same commodity exposure but completely different margin structures.
The Chinese metals and mining industry recorded revenues of $1.37 trillion in 2024, representing a CAGR of 9.6% over the prior period — making it the largest metals and mining market by revenues globally. The scale is a function of China’s role as both the dominant global producer and the dominant consumer of industrial metals and critical minerals.
Sector Map Table
| Subsector | Primary Products | Revenue Drivers | Key Risks | Representative Names |
|---|---|---|---|---|
| Base Metal Mining | Copper ore, aluminum bauxite, zinc concentrate | Commodity spot price, ore grade, mine throughput | Mine depletion, cost inflation, capex overruns | Zijin Mining (601899/2899.HK), CMOC (603993/3993.HK) |
| Copper Smelting/Refining | Copper cathode, copper rod, foil | TC/RC spread, cathode premium, volume | Concentrate scarcity, TC/RC collapse | Jiangxi Copper (600362/358.HK), Tongling Nonferrous (000630) |
| Aluminum Chain | Alumina, primary aluminum, semi-fab | Aluminum price, power cost, bauxite sourcing | Energy policy, capacity caps, property demand | Chalco (601600/2600.HK), China Hongqiao (1378.HK) |
| Rare Earth Mining | Light/heavy rare earth oxides, concentrates | REO price, quota policy, export controls | Quota allocation, environmental enforcement | China Northern Rare Earth (600111), Shenghe Resources (600392) |
| Rare Earth Processing | Separated oxides, metals, alloys, magnets | Processing spread, downstream demand, quota policy | Government pricing caps, substitution | JLMAG (6680.HK), Zhongke Sanhuan (000970), Grirem Advanced Materials (600549) |
| Gold/Precious Metals | Gold doré, silver by-products | Gold price, all-in sustaining cost (AISC) | Hedging policy, grade decline | Zijin Mining, Shandong Gold (600547/1787.HK) |
| Specialty/Battery Materials | Lithium carbonate, cobalt, graphite | EV demand, battery chemistry | Overcapacity, price cyclicality | Ganfeng Lithium (002460/1772.HK), Tianqi Lithium (002466/9696.HK) |
2. Value Chain Explained: The Investor’s Framework
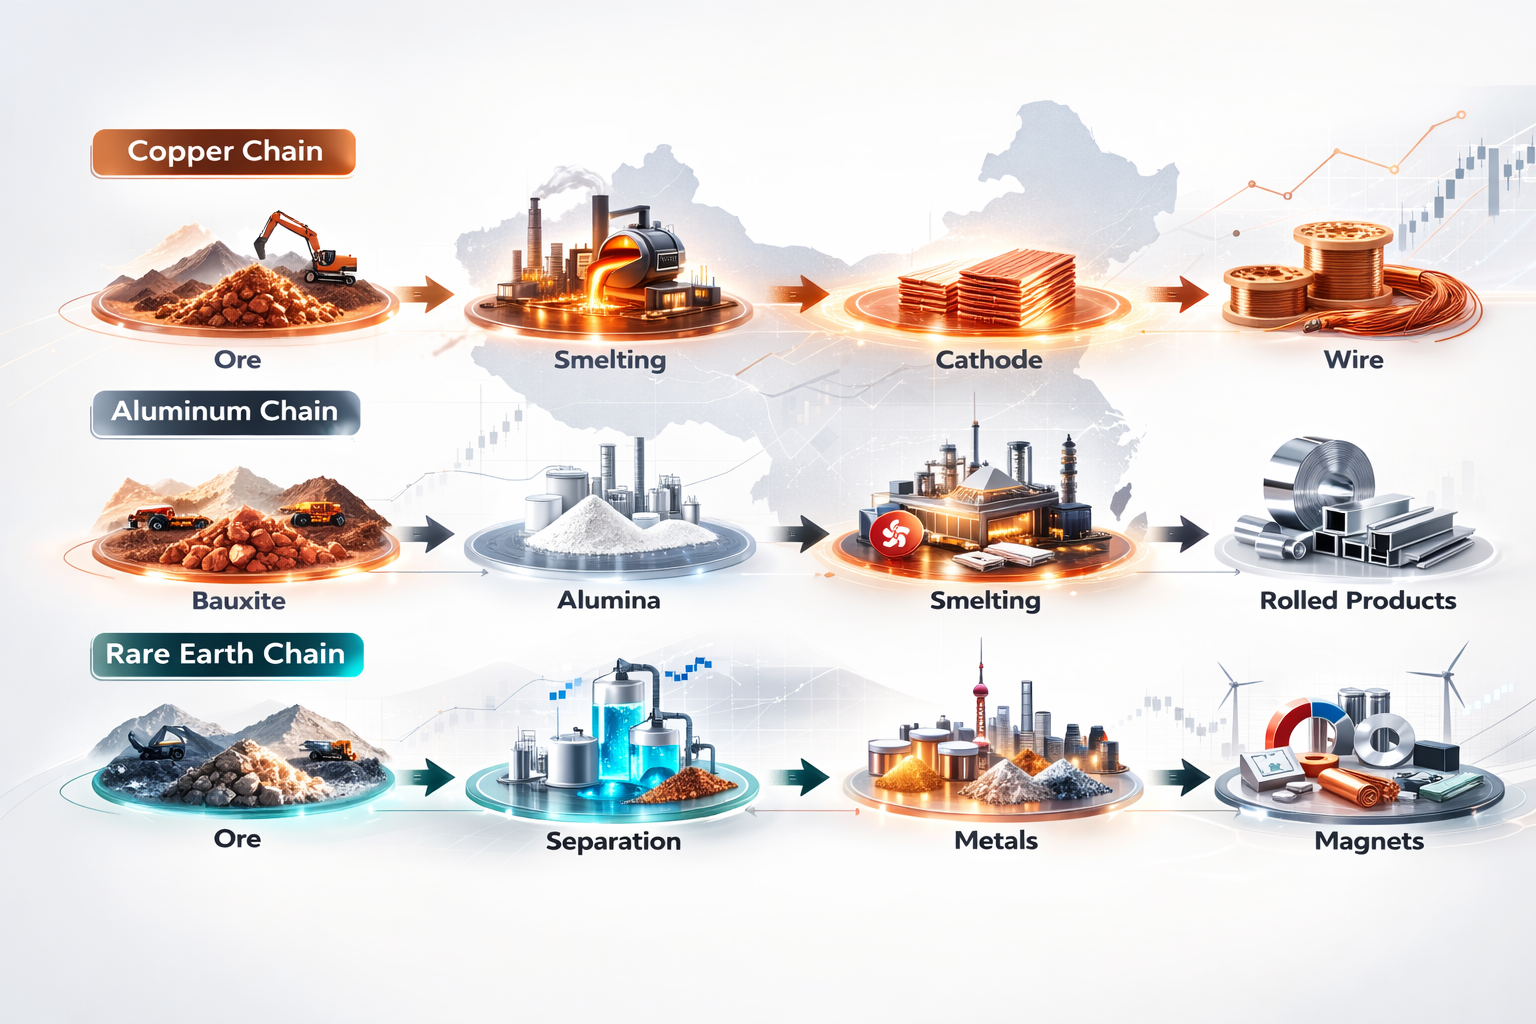
The Copper Value Chain
Copper moves through a five-stage value chain, and the investment implications differ at each stage:
Stage 1 — Mining (Ore/Concentrate): Copper ore (typically 0.5–2% copper grade) is mined and crushed into copper concentrate (~25–30% copper content). Producers here — Zijin Mining and CMOC being the premier Chinese examples — capture full commodity price upside. Profit is driven by grade, mine costs, and the spot copper price. This is the highest-leverage stage.
Stage 2 — Smelting (Concentrate to Blister Copper): Concentrate is heated in a smelter to produce 98% pure blister copper. Smelters charge miners a Treatment Charge (TC) for this processing. Smelters profit on the TC, not on the copper price per se. When mine supply is tight, TCs collapse (as in 2024-2025), squeezing smelter margins regardless of copper prices.
Stage 3 — Refining (Cathode): Blister copper is electrolytically refined to 99.99% pure copper cathodes — the London Metal Exchange (LME) deliverable standard. Refiners earn a Refining Charge (RC) on top of the TC.
Stage 4 — Semi-fabrication (Wire, Rod, Foil, Tube): Cathode is melted and drawn into wire rod, copper foil (battery and PCB applications), tubes, or sheet. This stage is much less commodity-exposed — margins are driven by fabrication complexity and customer contracts. Companies here have more stable earnings and are less correlated to copper spot prices.
Stage 5 — End Demand (EVs, Grid, Buildings): Copper is consumed in EV motors (~85 kg per BEV), power transmission cables, transformers, and air conditioning. This stage is not investable directly, but it is the demand signal that drives all upstream pricing.
Key Investor Insight: Jiangxi Copper operates primarily in Stages 2–4. Zijin Mining operates primarily in Stage 1, with some Stage 2 integration. For copper price upside exposure, Stage 1 miners offer far greater earnings leverage than Stage 2 smelters. For income and stability, integrated producers with their own mine supply offer superior resilience.
The Aluminum Value Chain
The aluminum value chain is structurally different from copper in one critical respect: energy cost is the primary cost driver, accounting for approximately 35% of total aluminum smelting cost.
Stage 1 — Bauxite Mining: Bauxite is the raw ore from which aluminum is extracted. China imports significant volumes from Guinea and Australia, creating a strategic dependency at this stage.
Stage 2 — Alumina Refining: Bauxite is refined via the Bayer process into alumina (aluminum oxide), the white powder precursor to aluminum metal. This requires significant chemical inputs and capital.
Stage 3 — Aluminum Smelting: The most energy-intensive step — alumina is electrolytically reduced (Hall-Héroult process) to primary aluminum. This is where power cost becomes the defining competitive variable. Chinese aluminum companies hold a structural advantage: China’s power tariff is 20% lower than India’s and 30–60% lower than comparable US and European rates, reducing production costs by RMB 1,200–3,600 per tonne.
Stage 4 — Semi-fabrication: Primary aluminum is rolled, extruded, or cast into sheets, extrusions, foil, and castings for construction, transportation, and packaging. Higher-value semi-fab products for automotive lightweighting and EV body panels command premium margins.
China’s capacity cap policy is a critical variable. China has maintained an informal ceiling of approximately 45 million tonnes on primary aluminum smelting capacity, limiting new greenfield additions and supporting prices for existing producers. Companies with captive hydropower (common in Yunnan Province and growing in Inner Mongolia) have the most durable cost advantage.
The Rare Earth Value Chain: The Most Strategically Important Section
Rare earth elements (REEs) are a group of 17 metallic elements — the 15 lanthanides plus scandium and yttrium — with unique magnetic, luminescent, and electrochemical properties that make them non-substitutable in a wide range of advanced technology applications. Understanding the rare earth value chain is essential for any investor in China metals and mining, because China’s dominance here is qualitatively different from its position in copper or aluminum.
Light vs. Heavy Rare Earth Elements
The 17 rare earth elements are divided into two groups based on atomic weight and geological occurrence, with fundamentally different supply chain dynamics:
Light Rare Earth Elements (LREEs) — primarily cerium, lanthanum, praseodymium, and neodymium — are more abundant, easier to separate, and found in large deposits like China’s Bayan Obo mine in Inner Mongolia. Neodymium and praseodymium (NdPr) are the commercially most critical LREEs, as they form the core of neodymium-iron-boron (NdFeB) permanent magnets used in EV motors, wind turbine generators, and industrial robots.
Heavy rare earth elements (HREs) — including dysprosium, terbium, europium, thulium, ytterbium, and holmium — are scarcer, harder to separate, and found primarily in ionic clay deposits in southern China (Jiangxi, Fujian, Guangdong). Heavy rare earth supply is the most constrained segment of the entire rare earth value chain. China’s official heavy rare earth supply has declined by approximately 90% over the past 20 years as the government restricted illegal mining and imposed stringent environmental regulations, creating structural scarcity that underpins prices for these elements. Dysprosium and terbium, used to enhance the thermal stability of NdFeB magnets, are the most strategically critical heavy rare earths globally.
Where Profits Sit in the Rare Earth Chain
The rare earth value chain contains six distinct stages, but profit concentration is uneven:
- Mining: Low margin in practice due to quota limits and government pricing guidance on concentrate.
- Physical and chemical separation: This is the critical processing step — separating mixed rare earth oxides into individual element oxides. China controls approximately 85–95% of global processing capacity for rare earth elements. Separation technology is deeply proprietary and took decades to perfect. This is a genuine competitive moat.
- Metal and alloy production: Converting oxides to metallic rare earths or into NdPr alloy.
- Magnet manufacturing: The highest-value-added stage. Sintered NdFeB permanent magnets are the most commercially significant downstream product. Companies producing high-performance magnets (like JLMAG and Zhongke Sanhuan) capture the largest share of value-added margin in the chain.
- Component manufacturing: Motors, actuators, transducers containing magnets.
- End use: EVs, wind turbines, robotics, defense electronics.
The investor implication: Mining-stage rare earth companies in China face government quota constraints and price controls that compress margins. Magnet manufacturers and separation/refining specialists often generate higher and more stable returns, though they are also exposed to downstream demand volatility.
3. What Drives Returns: The “Why Prices Move” Layer
Macro Drivers
China’s PMI — a real-time proxy for industrial activity — is the most important monthly release for base metals demand. The January 2026 Manufacturing PMI was 50.3, marginally expanding, though ING analysts flagged persisting domestic demand challenges. A sustained PMI recovery above 51 typically correlates with metals price strength within 1–2 quarters.
Credit impulse (the rate of change of new credit as a percentage of GDP) is the leading indicator for infrastructure-driven metals demand. When China’s credit cycle accelerates — as it did following the September 2024 stimulus announcement — copper, aluminum, and steel prices tend to rise 6–12 months later as construction and manufacturing activity catches up with monetary conditions.
The property market is both the largest source of demand uncertainty and the key drag on traditional materials stocks. Cement, construction-grade rebar, and residential copper wiring are all directly linked to housing starts, which remain depressed relative to 2019-2021 peak levels. Deloitte’s 2026 China outlook projects a modest stabilization in property, with new construction gradually recovering through 2026-2027 — but not returning to peak levels.
Commodity Pricing and Margin Transmission
The transmission from commodity prices to company earnings is direct but asymmetric across the value chain. For integrated miners (Stage 1): A 10% rise in copper price typically translates into a 25–40% earnings increase due to operating leverage (fixed cost structure means incremental revenue flows largely to EBIT). For smelters (Stage 2): The relevant price is the TC/RC spread, not the copper spot price. TC/RCs collapsed to record lows in 2025, driving losses at pure smelters like Tongling Nonferrous. For rare earth elements: China’s government sets quarterly guidance prices for rare earth oxides through the major state-owned enterprise groups. This managed pricing means NdPr prices are more stable than free-market equivalents — but can be disrupted abruptly when quotas are changed.
Policy and Export Controls
China’s export control apparatus for rare earth elements is the most powerful strategic commodity lever in the world today. The timeline of escalation through 2025 is instructive for investors:
- April 2025: China introduced mandatory export licensing for seven rare earth elements and all derived compounds, metals, alloys, and magnets
- August 2025: China tightened domestic production monitoring, requiring companies to report product flows in detail; stocks surged on the news (China Northern Rare Earth +9.9%, JLMAG +14%)
- October 2025: Five additional rare earth elements added — samarium, terbium, thulium, europium, ytterbium — with extraterritorial provisions targeting defense and chip manufacturing supply chains
- November 2025: Temporary suspension of export controls for one year following Trump-Xi diplomatic engagement
This cycle — escalate, then temporarily relax — has become China’s standard playbook for using rare earth elements as a geopolitical instrument. For investors, each escalation episode creates sharp upside volatility in Chinese rare earth stocks, followed by partial retracements. China Northern Rare Earth’s shares gained 22.09% in the first six weeks of 2026 alone.
FX and Funding
RMB depreciation reduces USD-equivalent returns from A-share and H-share holdings. However, for materials companies with dollar-denominated commodity revenues (copper and aluminum trade globally in USD) and RMB-denominated production costs, a weaker RMB is actually margin-accretive — it expands the cost-price spread. This creates a natural partial hedge for commodity producers.
Chinese industrial companies carry significant working capital financing requirements. The September 2024 stimulus package’s rate cut cycle — 25 bps on 1-year LPR — reduced interest costs and freed cash flow for miners and smelters operating on tight margins. Interest rate direction should be included in any scenario analysis for Chinese metals and mining stocks.
4. How to Invest: Access Routes for Foreign Investors
A-Shares (Shanghai/Shenzhen/STAR Market)
A-shares denominated in RMB are listed on the Shanghai Stock Exchange (SSE) and Shenzhen Stock Exchange (SZSE). Key Chinese metals and mining A-shares — including Jiangxi Copper (600362), China Northern Rare Earth (600111), and Zijin Mining (601899) — are accessible via Stock Connect’s Northbound route, which allows foreign investors to buy and sell eligible A-shares through their Hong Kong brokers without a QFII license.
China further liberalized A-share access in late 2024, reducing minimum foreign investment thresholds from 10% to 5% and shortening lock-up periods from 3 years to 12 months for strategic investors. This incremental opening has increased the investable universe but requires an international broker with Northbound Stock Connect access.
Hong Kong Listings (H-Shares and Red Chips)
The most accessible route for global institutional investors remains HK-listed securities. The largest China metals and mining companies maintain dual listings — A-shares in Shanghai and H-shares in Hong Kong — and the H-shares almost universally trade at a discount to their A-share equivalents. This H-share discount represents structural value for international buyers obtaining the same claim on assets at lower prices.
The top holdings in the MSCI China Materials Index are all accessible via Hong Kong: Zijin Mining H (2899.HK), China Hongqiao (1378.HK), CMOC H (3993.HK), Chalco H (2600.HK), and Jiangxi Copper H (358.HK).
ADRs
ADR coverage of China metals and mining is thin. The most relevant OTC ADRs are Aluminum Corporation of China (ALMMF), which trades on the US OTC market but with limited liquidity. ADR investors in this sector bear VIE structural risk where applicable and HFCAA compliance risk. For serious institutional allocation to China metals and mining, H-shares via HK broker or Stock Connect A-shares are structurally superior.
Decision Table: Access Route Framework
| Investment Goal | Best Route | Why | Key Risk |
|---|---|---|---|
| Broad China Materials exposure | MSCI China Materials ETF or MCHI | Low cost, diversified, no single-stock risk | Moderate China cost; gold-heavy index |
| Target copper/aluminum SOE | H-shares (HK broker) | Direct ownership, no VIE, H-share discount | Broker setup, HKD liquidity |
| Target A-share specialist (rare earths) | Stock Connect via HK broker | Only route to key A-share-only names | RMB FX, mainland market volatility |
| Thematic rare earth exposure | Global X China Materials ETF or basket | Diversified RE exposure with liquidity | Sector concentration, policy binary |
| Non-China rare earth diversification | Lynas Rare Earths (ASX: LYC) or US miners | No China political risk; HRE alternative supply | Higher cost, smaller scale |
5. Stock Selection Framework: Outranking the Screeners
A screener can show you P/E ratios and revenue growth. It cannot tell you whether a company’s earnings are sustainable through the commodity cycle, whether its balance sheet can withstand a TC/RC collapse, or whether its ownership structure aligns management incentives with shareholders. The following framework addresses what screeners miss.
The Six Analytical Pillars
1. Cost Curve Position and Energy Intensity
The most durable competitive advantage in commodities is being the lowest-cost producer on the global cost curve. For aluminum, this means captive renewable power. For copper, it means high ore grade and low strip ratio. For rare earth elements, it means access to high-concentration ionic clay deposits or Bayan Obo ore with efficient separation circuits. Ask: Where does this company sit on the global cost curve? Can it remain profitable if the commodity price falls 30%?
2. Integration Advantage
Vertically integrated producers capture margin across multiple value chain stages. Zijin Mining’s expansion from gold/copper mining into smelting and downstream processing reduces its dependence on TC/RC spreads and creates more stable aggregate earnings. In rare earths, companies with both separation and magnet manufacturing capability capture significantly more margin than pure miners. Ask: What stages of the value chain does this company control? What percentage of its ore is self-sourced?
3. Capex Cycle and Maintenance Capex
China’s metals companies are capital-intensive businesses that require continuous replacement investment to maintain production levels. Maintenance capex vs. growth capex should be separately identified. Companies reporting strong cash flow during low capex phases but structurally requiring large periodic reinvestment may overstate their true free cash flow yield. Ask: What is the sustainable normalized free cash flow after maintenance capex?
4. Balance Sheet Resilience
Commodity companies are cyclical, and the commodity cycle does not wait for debt maturities to align with price recoveries. Screen for: (a) total debt-to-EBITDA below 3x (preferred below 2x); (b) short-term debt as a percentage of total debt below 30%; (c) interest coverage ratio (EBIT/interest expense) above 3x at mid-cycle commodity prices. SOEs in China benefit from implicit banking support but private companies may face sharper refinancing pressures during credit tightening cycles.
5. Governance: SOE vs. Private
State-owned enterprise status in Chinese mining is a double-edged sword. SOE companies (China Northern Rare Earth, Chalco) benefit from state banking access, government contracts, and implicit bailout protection. However, capital allocation is subject to strategic national mandates that may not align with minority shareholder return maximization. Private companies like Zijin Mining and China Hongqiao have demonstrated more aggressive international expansion, better return on equity, and stronger dividend growth. Ask: Is this company’s capex directed by commercial logic or national mandate?
6. Pricing Power vs. Commodity Taker
The most important long-run differentiator within the sector. Pure commodity producers have zero pricing power; they take whatever the market offers. Companies with proprietary downstream products (specialty magnets, high-purity rare earth oxides, copper foil for specific EV battery chemistries) can charge premiums over commodity benchmarks. In rare earths, the magnet manufacturers that have signed long-term supply agreements with major EV manufacturers effectively operate like specialty industrial companies within a commodity sector.
10-Question Checklist Before Buying
- What percentage of revenue comes from commodity price vs. processing spread vs. downstream fabrication — and which is most volatile?
- Does the company own its ore source, or does it depend on purchasing concentrate from third parties?
- Where is the company on the global cost curve for its primary product? Can it remain profitable at the 10th percentile price (a severe downturn scenario)?
- What is the current debt-to-EBITDA ratio at mid-cycle commodity assumptions?
- Does operating cash flow historically reconcile with reported net income, or are there large working capital movements that inflate earnings?
- Is this an SOE or private company — and what are the implications for capital allocation, dividend policy, and strategic direction?
- Has this company received environmental enforcement actions in the past three years? Does its production depend on permits that are subject to regulatory renewal?
- How concentrated is the customer base? Are there take-or-pay contracts with key customers that provide earnings visibility?
- Is the stock accessible via H-share or Stock Connect, and what is the current A/H premium or discount?
- What is the specific policy exposure — export controls, quota allocations, government pricing guidance — that could change earnings materially within one quarter?
6. Rare Earth Investing Module
What Makes Rare Earth Pricing Volatile
Unlike copper or aluminum, which trade on transparent global exchanges (LME), rare earth elements are priced through a combination of Chinese government guidance prices, bilateral contracts, and opaque spot markets. The major rare earth oxide prices (NdPr oxide being the most watched) are reported by industry data providers like Asian Metal and Shanghai Metals Market, but do not have exchange-based transparent settlement.
This opacity creates extreme price volatility:
- NdPr oxide prices rose from approximately $40/kg in 2019 to a peak of $180/kg in early 2022, then fell to approximately $40–50/kg by 2024
- The decline was driven by slower-than-expected EV adoption growth, inventory destocking at magnet manufacturers, and Chinese government quota increases
- When China’s export controls were introduced in April 2025, NdPr prices began recovering; by Q3 2025, magnet exports had jumped nearly 75% month-over-month following diplomatic easing
Why Separation and Processing Matters More Than Mining
China controls approximately 85–95% of global processing capacity for rare earth elements, and this processing dominance is far harder to replicate than the mining itself. Separation technology — the hydrometallurgical process of isolating individual rare earth elements from mixed concentrates — took China decades to perfect through state investment, trial and error, and economies of scale. This expertise represents a genuine competitive moat.
Even countries with significant rare earth mineral reserves (the US at Mountain Pass, Canada, Kazakhstan, Brazil) depend on China for separation and processing. Outside of China, the only company with commercially viable integrated separation capability beyond a pilot scale is Lynas Rare Earths — the Australian producer that operates the Mt. Weld mine in Western Australia and a processing facility in Malaysia. Lynas rare earths operations represent the world’s only significant non-Chinese rare earth separation supply chain, producing approximately 500–600 tonnes of heavy rare earth elements annually, roughly 15–20% of non-Chinese global supply. Lynas rare earths production is increasingly viewed as a strategic non-Chinese anchor supply source, with growing relationships with US, European, and Japanese government-backed procurement programs.
Magnet Exposure vs. Mining Exposure
From an equity return perspective, NdFeB magnet manufacturers offer different risk/return characteristics than rare earth miners:
Miners/Oxide Producers (e.g., China Northern Rare Earth):
- Direct commodity price leverage
- Subject to government quota allocation
- Binary policy risk: quota increases destroy margins rapidly
- High beta to geopolitical events
- China Northern Rare Earth H1 2025 profit surged 1,951% year-over-year on higher NdPr prices
Magnet Manufacturers (e.g., JLMAG, Zhongke Sanhuan, Grirem):
- Spread between magnet price and oxide input cost
- Long-term supply contracts with OEMs reduce volatility
- Higher value-add, more stable margins
- Demand closely tied to EV production volumes and wind turbine orders
- Less directly impacted by export control events (they are the beneficiary, not the target, when controls restrict oxide exports)
For investors seeking lower-volatility exposure to rare earth elements, magnet manufacturers with signed OEM contracts offer a more predictable earnings profile than oxide-stage miners.
The Rare Earth Elements Playbook Table
| Exposure Type | Example Business Model | What to Monitor | Biggest Risk |
|---|---|---|---|
| Light REE mining (LREE) | SOE mining neodymium/praseodymium from Bayan Obo or ionic clay | Quarterly Chinese REE quotas; NdPr spot price; government guidance price changes | Quota increase compresses all producer margins simultaneously |
| Heavy rare earth separation | Ionic clay mining + in-situ leach separation in southern China | Environmental enforcement; illegal mining competition; HRE oxide prices | Tightening environmental rules close entire provinces of production |
| NdFeB Magnet Manufacturing | Producing sintered magnets for EV motors; signed OEM supply contracts | EV sales volumes; wind energy capacity additions; customer contract renewal | Customer concentration; loss of major OEM supply agreement |
| Separation/Processing Specialist | Operating dedicated separation plants; tolling arrangement with miners | Processing spread (oxide vs. concentrate); throughput utilization | Chinese government pricing caps on oxides squeezing processors |
| Non-China REE (e.g., Lynas Rare Earths) | Integrated mining-to-separation outside China; growing HRE capability | US/EU government offtake support; Mt. Weld mine life; Malaysia operating permits | Higher costs than Chinese competitors; geopolitically dependent on Western policy support |
Key Investor Risks in Rare Earth Elements
- Quota volatility: The Chinese government sets annual and semi-annual mining and smelting quotas. Unexpected quota increases can flood the market with supply, collapsing prices within weeks.
- Export control binary risk: As demonstrated in 2025, export controls can be imposed suddenly and reversed diplomatically — creating extreme but temporary stock price moves.
- Substitution risk: Long-term, technology companies are actively investing in reducing rare earth content in motors (ferrite-based motors for lower-speed applications, motor designs that reduce dysprosium loading). Substitution would reduce demand for the most strategically valuable elements.
- Recycling: End-of-life magnet recycling is growing, potentially creating a secondary supply source that competes with primary production from the 2030s onward.
- Demand cyclicality: While structural EV and wind demand is real, the timing of ramp-up is uneven. EV penetration rates that miss forecasts by even 10% can create multi-year inventory overhangs for rare earth elements.
7. Risks: Deep and Investor-Grade
Commodity Cycle Drawdowns
The MSCI China Materials Index recorded a maximum drawdown of 90.64% between October 2007 and October 2008. This is not a historical curiosity — it reflects the fundamental reality that commodity companies with fixed cost structures and leveraged balance sheets can lose almost all their equity value when commodity prices fall during a demand shock. Any China materials allocation must be sized with the assumption that a severe drawdown is possible within any given investment horizon.
China Policy and Regulatory Shifts
The Chinese government has the ability and willingness to restructure industry economics through administrative action. Key policy instruments include: production quota allocation for rare earths and coal; environmental enforcement that shuts facilities without judicial review; export controls that can be imposed or lifted in weeks; and centralized pricing guidance that can cap upside for commodity producers. The 2025 rare earth export control sequence illustrated the full cycle within a single calendar year.
Geopolitics, Tariffs, and Sanctions Spillovers
US export controls on semiconductor equipment directly restrict Chinese industrial automation upgrading. US tariffs on Chinese manufactured goods reduce demand for steel, copper, and aluminum from export-oriented manufacturing sectors. The risk of secondary sanctions — targeting Chinese companies that facilitate banned technologies — is a low-probability but high-impact tail risk for the institutional investor universe.
Environmental Rules and Energy Constraints
Chinese environmental enforcement has become materially more stringent since 2015, and this directly affects materials production. Southern China ionic clay deposits — the primary source of heavy rare earth elements — are subject to in-situ leach mining restrictions that have contributed to a 90% decline in official heavy rare earth supply. Aluminum smelters in provinces that fail to meet energy intensity targets can face forced production cuts. Carbon market policy (China’s national ETS) will increasingly impose carbon costs on energy-intensive materials production.
Accounting and Transparency Variance
Chinese GAAP (CAS) differs from IFRS in several areas relevant to materials companies: government grants and subsidies are often reported as non-operating income but can be material (10-20% of net profit for some SOEs); environmental liability provisioning is often below international standards; and accounts receivable from government-related entities may be classified as current even when de facto long-term. International investors using financial databases should verify adjustments for these items before comparing margins across jurisdictions.
Liquidity and Market Structure
A-share materials stocks are subject to daily 10% price limit bands, circuit breakers, and retail-driven sentiment momentum. Position sizes must account for daily trading volume limitations, particularly for mid-cap rare earth stocks where a single large institutional order can move prices materially. H-shares tend to have better institutional liquidity but can still experience sharp bid-ask spread widening during Hong Kong market stress events.
Currency Risk for USD-Based Investors
RMB-denominated A-share returns experience full USD/CNY currency risk. However, for commodity producers with dollar-referenced revenues (metals prices are globally set in USD) and RMB-denominated costs, currency exposure is partial and directionally favorable during RMB depreciation cycles. H-share investors holding HKD-denominated securities benefit from the HKD peg to the USD, removing the FX translation layer — though underlying RMB earnings still translate at prevailing rates.
8. FAQ: People Also Ask
What is the best rare earth stock to buy?
No single stock can be designated “best” without reference to an investor’s specific risk tolerance, cycle view, and investment horizon. The analytical framework recommends evaluating three dimensions: (1) Value chain stage — do you want commodity leverage (oxide miners) or structural earnings quality (magnet manufacturers)? (2) Policy sensitivity — how exposed is the company to Chinese government quota or export control decisions? (3) Integration level — companies with both separation and downstream capabilities tend to offer more stable through-cycle margins. Applying this framework, investors seeking lower-volatility exposure typically find magnet manufacturers with OEM contracts more attractive; investors seeking higher beta to policy events or rare earth price spikes may prefer large-cap oxide producers like China Northern Rare Earth.
How do you invest in China’s rare earth minerals?
Foreign investors have four routes: (1) A-shares via Stock Connect — the primary access route to companies like China Northern Rare Earth (600111) and Shenghe Resources (600392), requiring a Hong Kong broker with Northbound Connect access; (2) HK-listed H-shares — JLMAG (6680.HK) is listed in Hong Kong; (3) US-listed non-China proxies — Lynas Rare Earths (ASX: LYC; OTC: LYSCF) offers non-China exposure to rare earth elements including production of heavy rare earth elements from the Mt. Weld mine; (4) Thematic ETFs with materials exposure such as Global X China Materials ETF or VanEck Rare Earth/Strategic Metals ETF (REMX) which includes both Chinese and non-Chinese rare earth element producers.
What is China’s market share in rare earth metals?
The figures vary by stage of the value chain, and investors should distinguish between them carefully. At the mining stage, China accounts for approximately 60–70% of global rare earth oxide production, with the remainder largely from the US (Mountain Pass), Australia (Mt. Weld operated by Lynas), Myanmar, and Russia. At the processing and separation stage, China’s share rises to approximately 85–95% of global capacity, reflecting decades of accumulated processing expertise and infrastructure. At the magnet manufacturing stage (the highest value-added step), China controls an even larger share of global capacity. The critical investor insight is that mining share understates China’s true supply chain leverage — it is the processing chokepoint that generates the strategic control.
What are the best Chinese stocks to invest in?
This question is best answered with a method rather than specific names. For the metals and mining sector, quality is defined by: cost curve position, integration level, governance quality, balance sheet resilience, and policy exposure. Within China metals stocks, the companies that have demonstrated the most consistent combination of earnings growth, capital discipline, and international diversification are the large integrated miners/processors — rather than pure-play commodity producers at single stages of the value chain. The diversity of access routes (A-shares for pure domestic plays, H-shares for international-quality assets at discount, ETFs for diversified sector exposure) means the optimal “best stocks” answer also depends on an investor’s access infrastructure and compliance requirements.
9. Conclusion
China metals and mining stocks occupy a unique position in global investing: they offer the deepest commodity cycle leverage of any market, the most strategically critical supply chain exposures, and a layer of geopolitical complexity that requires ongoing monitoring rather than a one-time assessment.
How to Choose Exposure by Metal
- Copper: Favor integrated miners with significant self-owned mine production (Stage 1) for copper price leverage; Zijin Mining (HK H-share: 2899.HK) is the benchmark growth vehicle. Jiangxi Copper (HK H-share: 358.HK) offers income at lower earnings volatility. The catalyst to watch is TC/RC recovery — a return to normal processing margins would materially expand smelter earnings.
- Aluminum: Favor producers with captive renewable power, particularly China Hongqiao (1378.HK) and Chalco (2600.HK), whose power cost advantage over global peers is 20–60% lower and is likely to persist given China’s power infrastructure. The catalyst is China’s capacity cap discipline — any relaxation of the 45-million-tonne ceiling would be a material negative.
- Rare Earth Elements: For policy event-driven positioning, large-cap oxide producers (China Northern Rare Earth, 600111) offer the highest beta. For structural growth with lower volatility, NdFeB magnet manufacturers with EV OEM contracts (JLMAG, 6680.HK; Zhongke Sanhuan, 000970) offer more durable compounding. Monitor quarterly rare earth mining and smelting quotas as the single most important data release.
Best Route for Most Investors
For investors without dedicated China research capabilities and an international broker with Stock Connect access, the MSCI China Materials Index-tracking ETF (or a broad China ETF like MCHI where Materials represents approximately 6%) provides the most efficient, diversified entry point. The MSCI China Materials Index returned +104.58% in 2025 alone, dramatically outperforming the broad MSCI China (+22.59%) — though this extraordinary single-year outperformance should be understood as partly catch-up from prior-year underperformance and partly a rare earth export control premium that may not fully persist.
Key Indicators to Watch in 2026
- China Manufacturing PMI trend — sustained expansion above 51 is necessary for broad base metals demand recovery
- Rare earth quarterly quota announcements — any increase above 2025 levels will compress NdPr prices; any further export control escalation (post-November 2026 suspension expiry) creates upside binary risk
- TC/RC benchmarks — annual copper concentrate treatment charge negotiations determine 2026 smelter margins; recovery from 2025 record lows is the critical swing factor for Jiangxi Copper and Tongling
- China aluminum power tariff policy — any changes to industrial electricity pricing in Yunnan or Inner Mongolia directly affect aluminum smelter cost advantages
- Property market housing starts — the leading signal for steel, cement, construction-grade copper and aluminum demand recovery
This guide is for informational purposes only and does not constitute financial advice. Investment decisions should be made with reference to individual risk tolerance and professional guidance.